Reviewed by the PeptideMind Team · Updated August 10th, 2026
Free Peptide Half-Life Calculator
Model how peptide concentrations build over a research cycle. Enter a compound's half-life, research quantity, and frequency to see how active levels reach steady state — plot up to five peptides simultaneously across 90 days. Pre-loaded with half-life data for 100+ research peptides. For research purposes only — no signup required.
peptidemind.com
Half-Life Calculator — Model how peptide levels build to steady state.
As seen on






What is peptide accumulation?
Accumulation is what happens when administrations arrive faster than a compound clears. Whether a peptide builds up or washes out comes down to two numbers: its half-life and the dosing interval.
Half-life sets the pace
A peptide's half-life is the time it takes for half of the active compound to clear. Short half-lives (minutes to hours) clear between administrations; long half-lives (days) leave residual compound behind.
Residual levels stack
When the next administration lands before the last one has cleared, the doses stack. Each administration adds to what remains, and the active level climbs across the research cycle.
Steady state is the plateau
Around five half-lives in, the amount cleared between administrations equals the amount added — the plateau called steady state. The calculator marks the estimated steady-state day for each compound.

Reading the accumulation chart
The chart plots estimated active concentration in micrograms for every compound across the selected window, based on exponential decay from each administration.
One curve per compound
Each compound plots its own concentration curve, colored to match its card. Compare up to five compounds at once to see which build and which clear.
Max, min, and steady state
Below the chart, each compound shows its peak concentration, trough concentration, and the estimated day it reaches steady state within the selected window.
14, 30, or 90 day windows
Switch the chart between 14, 30, and 90 day views. Short windows show the early buildup phase; the 90-day view shows the full plateau.

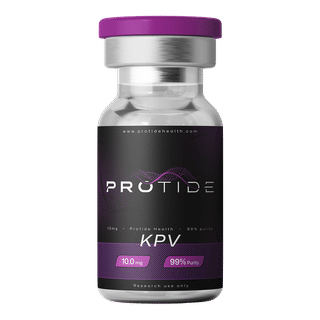
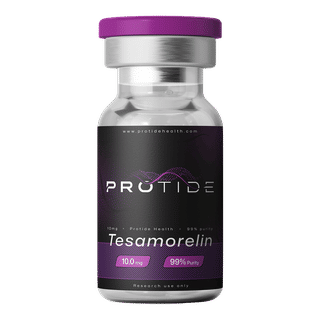
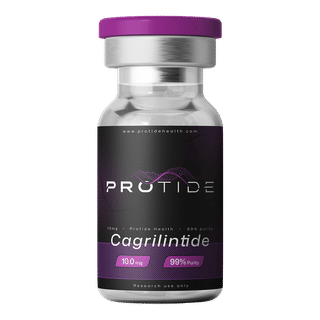
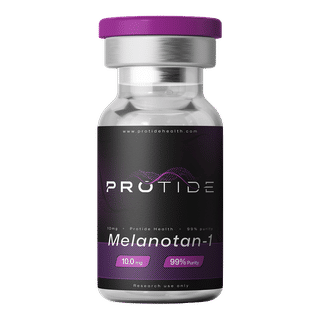
Shop research peptides
Live pricing from our top-rated vendor. Prices update as vendor listings change.
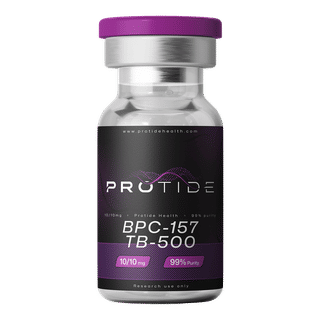
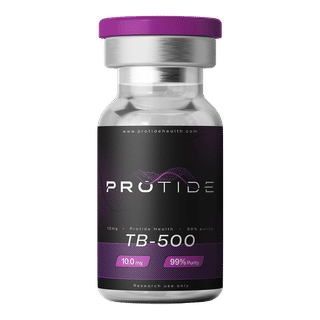
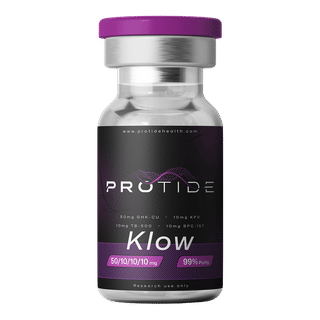
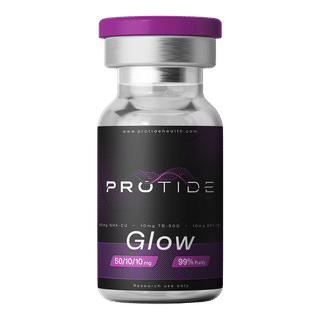
How peptide accumulation is calculated
Accumulation is driven by the relationship between dosing interval and half-life. When doses arrive faster than the peptide clears, concentrations build over time until a steady state is reached.
Select a peptide and confirm its half-life
Search for your peptide by name — half-life data is pre-loaded. Half-life is the time a biological system takes to eliminate half the active compound, and it determines how much peptide remains at the start of each subsequent research administration.
Set your dosing frequency and dose size
Enter the research frequency and quantity. When the interval between administrations is shorter than the half-life, peptide concentrations build with each administration. Wider spacing allows clearance between administrations and limits accumulation.
Read the steady-state chart
The calculator simulates 90 days of dosing and plots active concentration over time. Look for where the curve flattens — that's your steady state, the level reached when dose-in equals dose-out each dosing interval.
Half-life, frequency, and why curves differ
Dose alone doesn't determine active levels — the interaction between half-life and administration frequency shapes the entire curve. These are the levers the calculator models.
Frequency drives buildup
Daily administrations of a long half-life compound build far higher levels than weekly ones. The interval between administrations matters as much as the dose itself.
Same dose, different curves
Two compounds at identical doses can produce completely different curves — a 30-minute half-life stays flat while a 5-day half-life climbs for weeks.
Override the defaults
Half-life data is pre-loaded for 100+ research peptides, and every value can be overridden to model a custom compound or a different clearance assumption.

Frequently Asked Questions
Straight answers on half-lives, steady state, and reading concentration curves. For research reference only.
Peptide-Specific Dosage Calculators & Guides
Get exact reconstitution and draw volume instructions for the most-searched research peptides, including BPC-157, TB-500, MOTS-C, and PT-141. Each guide has its own pre-loaded dosage calculator with reference dose ranges, half-life, and reconstitution steps for that specific peptide. For research purposes only.
Weight
GLP-3
Metabolic
Weight
GLP-2
Metabolic
Peptide half-life calculator stats
90
day simulation
Models active peptide concentration across a full 90-day research cycle based on half-life and administration schedule.
5
compounds at once
Stack up to five peptides simultaneously to compare accumulation curves and spot interaction patterns.
100+
peptides pre-loaded
Half-life data is pre-loaded for over 100 research peptides — select a name and the calculator fills in the rest.
Calculate peptide dosages
Reference our peptide quantity, blend, and accumulation calculators for laboratory purposes. Enter vial size, reconstitution volume, and target research quantity to calculate exact draw volumes instantly. All calculators are for research use only and do not constitute dosing or administration guidance.
